Help Users See Progress Through a Longer Process

Help Users See Progress Through a Longer Process
Some processes need a lot of information. An 8D Problem Analysis (PA) brings together the problem, the team, containment actions, possible causes, corrective action and follow-up. Giving each stage its own section keeps the work organised, but a long record can still leave users wondering: How far have we got, and what needs attention next?
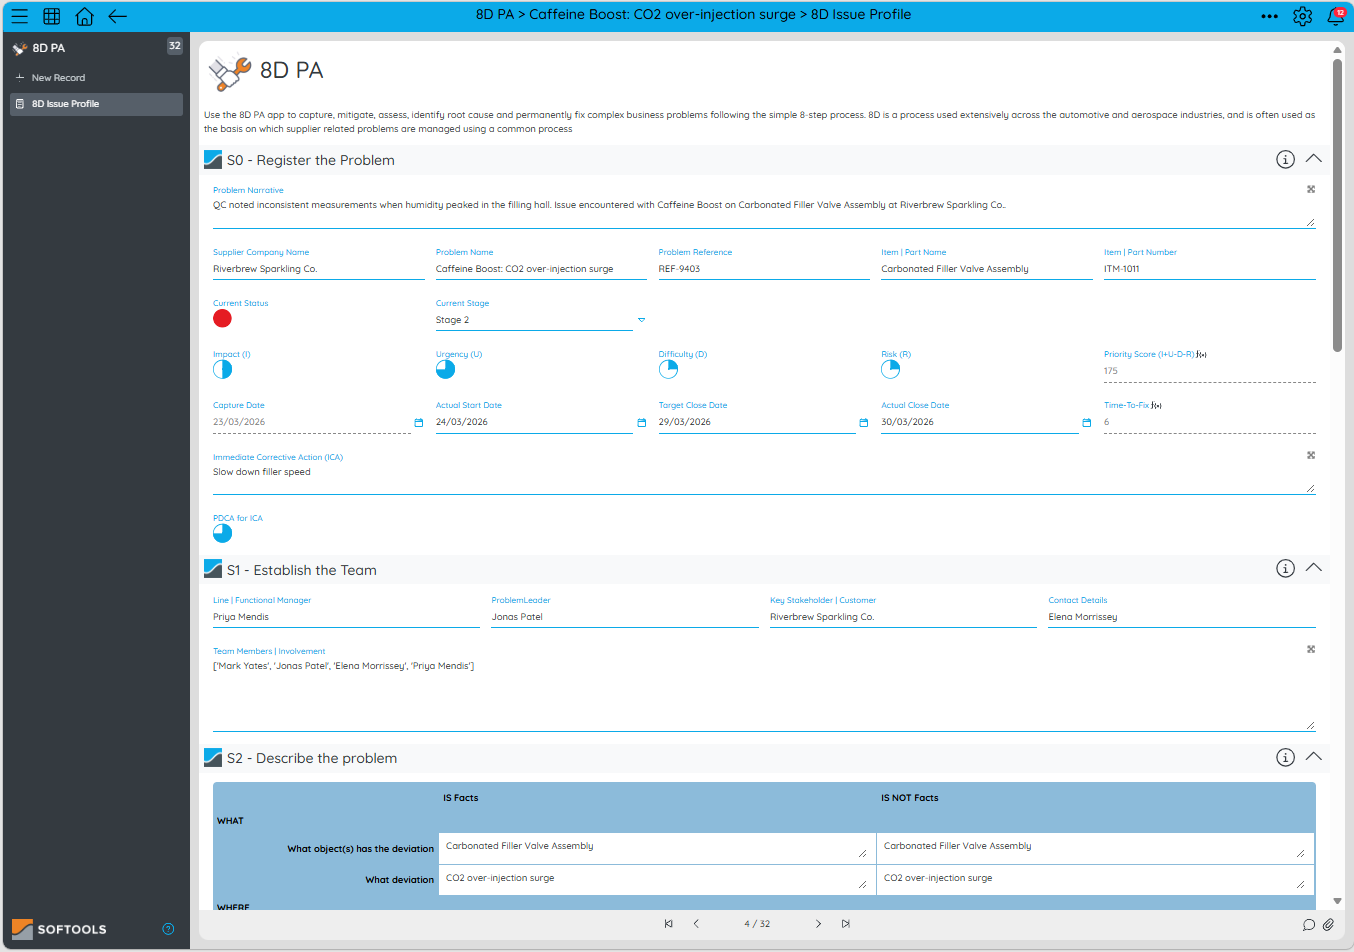
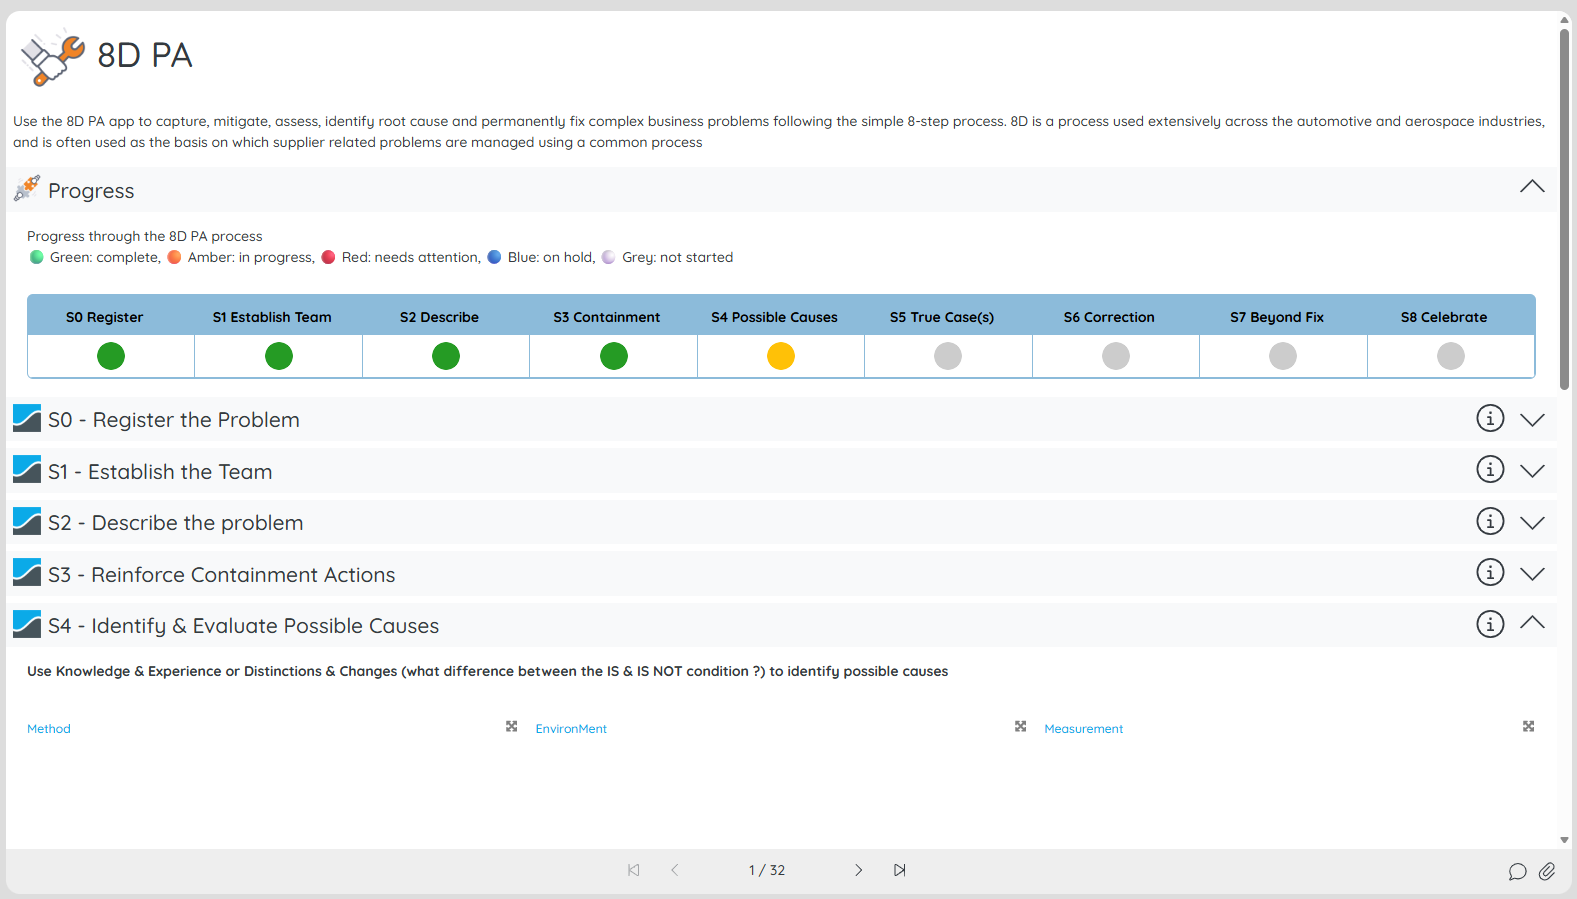
A simple improvement is to put a progress visual at the top of the record. In this example, each stage has a coloured indicator:
-
🟢 Green: complete
-
🟠 Amber: in progress
-
🔴 Red: needs attention
-
🔵 Blue: on hold
-
⚪ Grey: not started
The stages sit below the visual in collapsible sections. Users can concentrate on the section they’re working on, while still seeing the whole journey and how much has been completed.
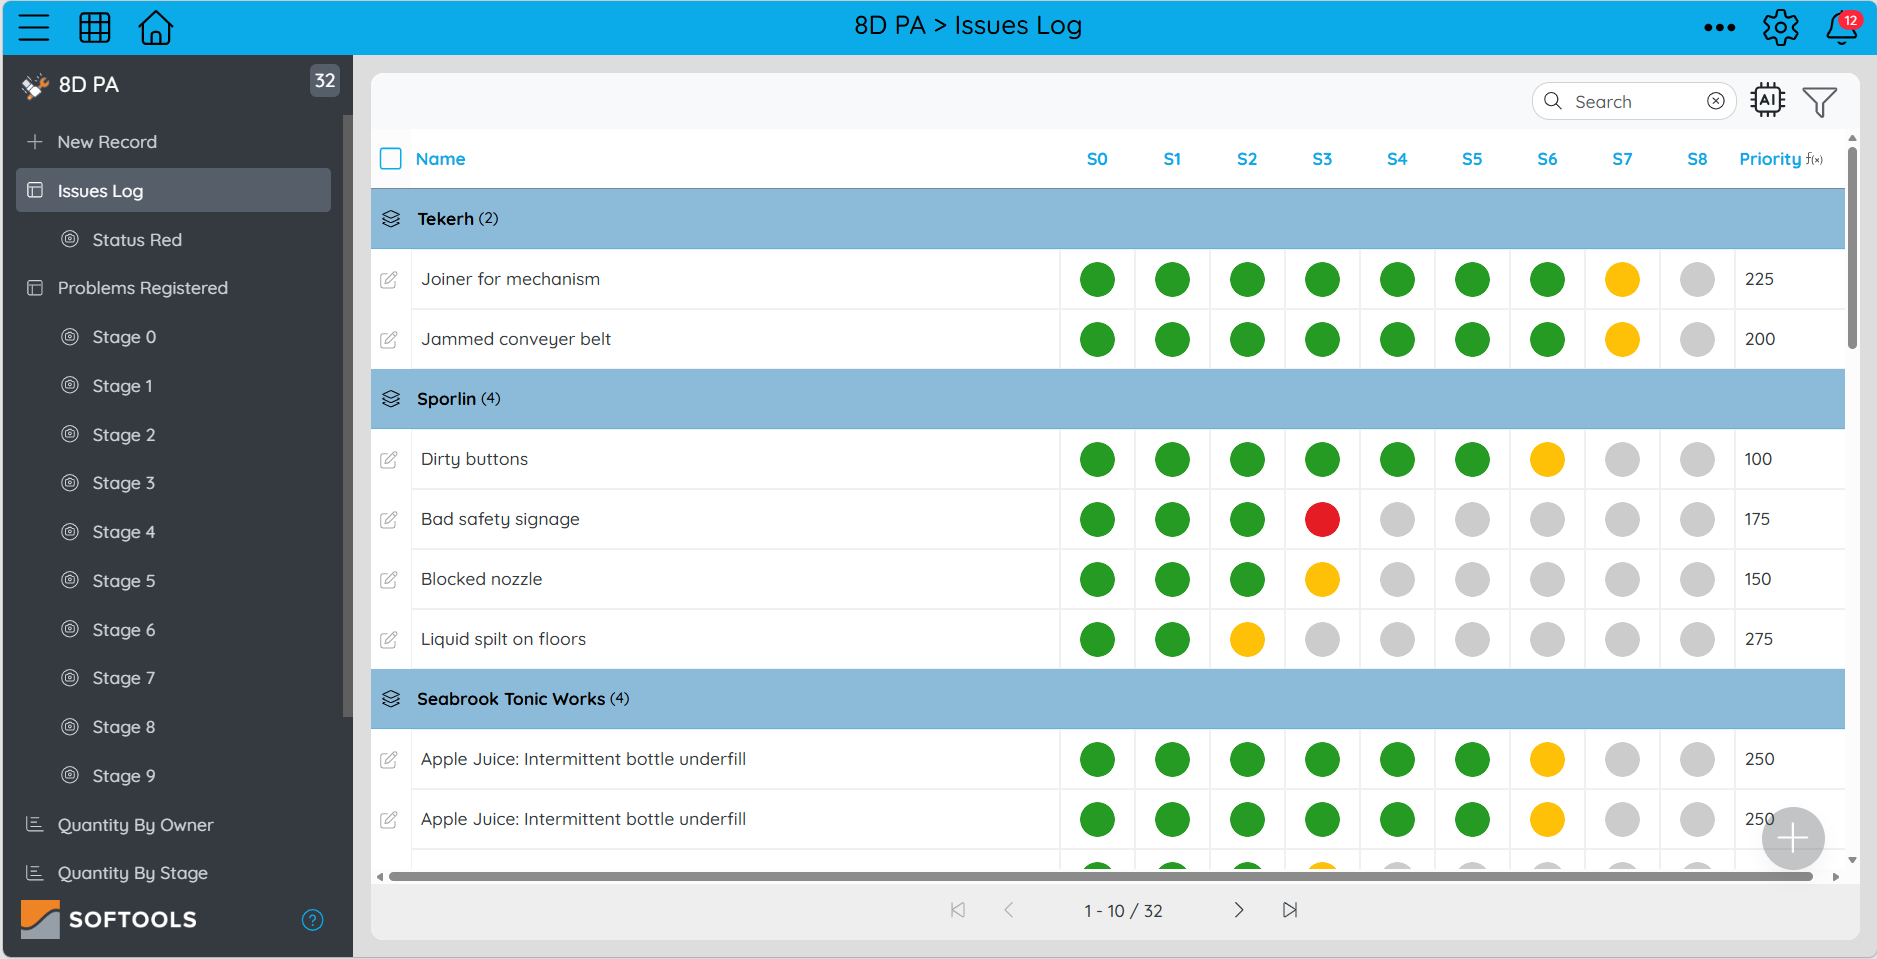
The same idea is useful beyond an individual record. Add the stage indicators as columns in a table report, and the team can scan several investigations at once. Here, the Issues Log is grouped by company, making it easier to see which 8D PAs are moving forward and which may need support.
If you’re building an App for a long or demanding process, consider showing progress in both places: inside the record to guide the person doing the work, and in a report to give the wider team an overview. The approach could work just as well for audits, onboarding, assessments or improvement plans.
Please sign in to leave a comment.
Comments
0 comments