Weekly Reporting on a Period Field Expression

In this post, I'll be showing you how to create some nice reports using the period expression in a text field. This can be because you want to show weekly trends for spend to date, or maybe you want to see on which week the most status red items were raised. These types of reports are very popular because it orders the data in a visually easy to read way and can bring a lot more value to the data.
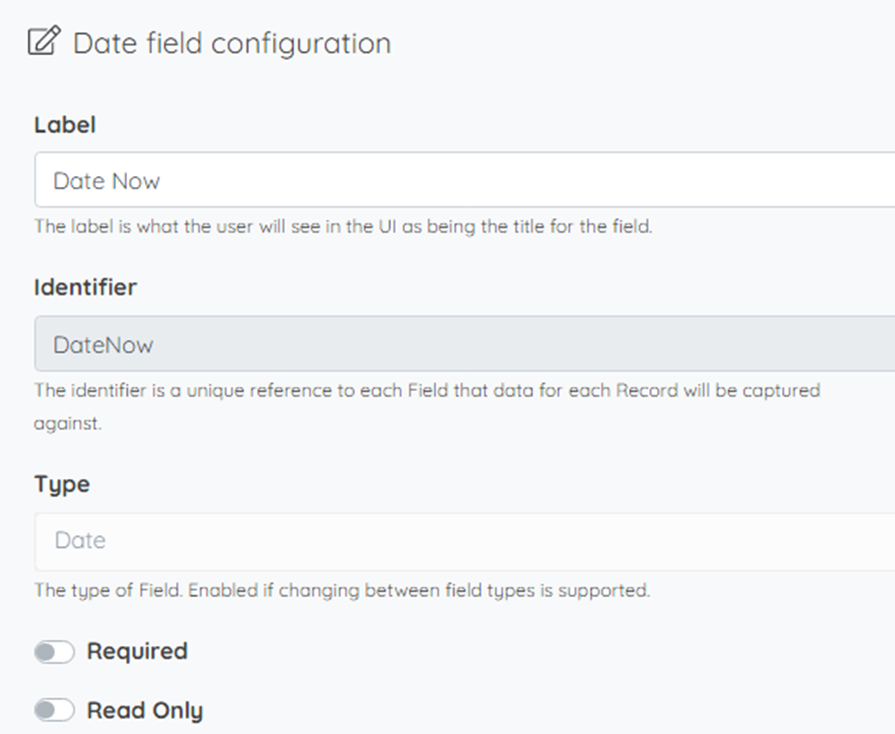
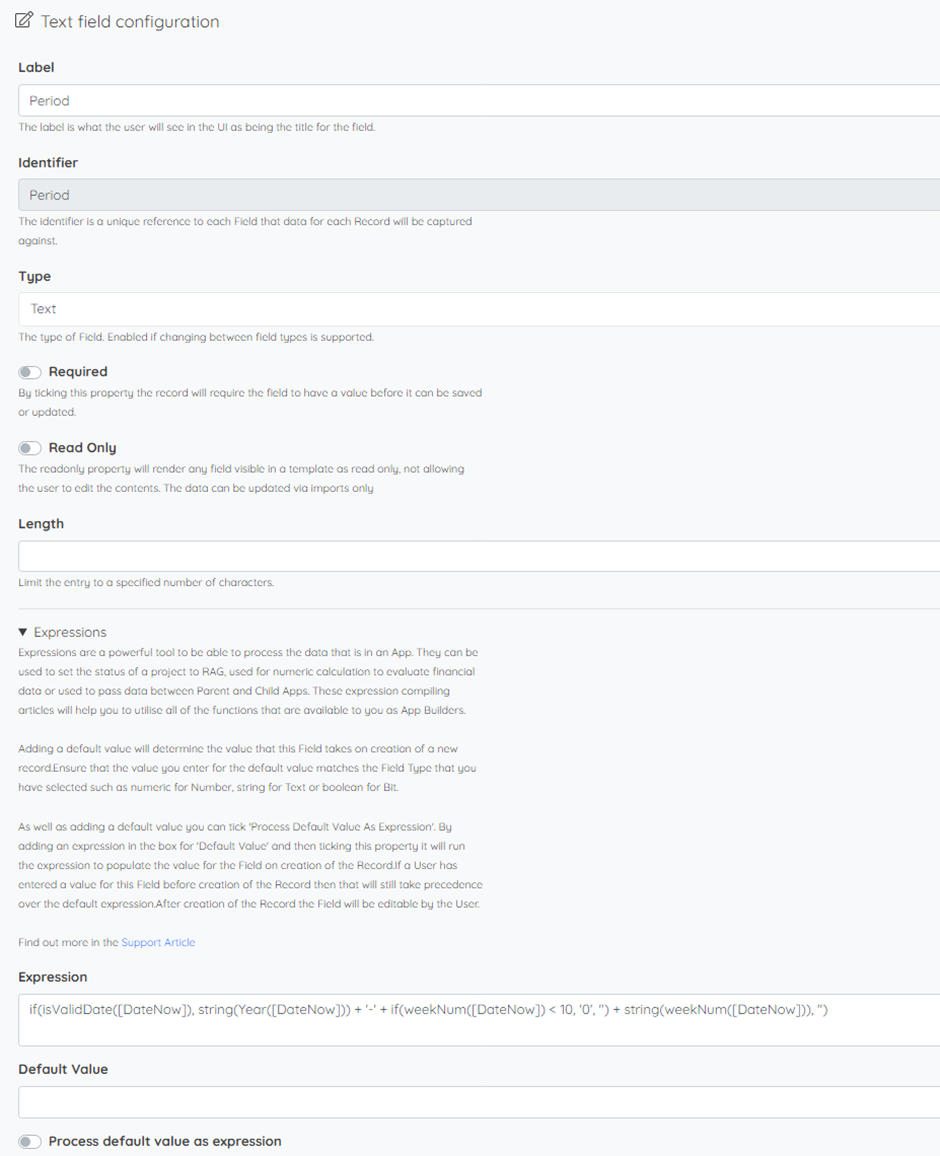
First, you will need to create a date field, this is the date that the reporting will be based off, this can be an input field or an expression run field that is based on when the record was created. After that, you then need to create a text field with the expression below.
if(isValidDate([DateNow]), string(Year([DateNow])) + '-' + if(weekNum([DateNow]) < 10, '0', '') + string(weekNum([DateNow])), '')
Breaking this expression up it starts off with an if statement checking to see if the date field has a valid date in it using the IsValidDate() function, if true then it runs the next expression if not it then displays nothing.
The next layer of the expression builds the string with the period the date is in. The Year() function pulls back the year of the date and the string() function converts it to string so it can be added to the next piece of string and not added as a number. The weekNum() function pulls back the week of the year the date is in, this pulls it back in the format 1, 2, 3 ,4 not 01, 02, 03, 04 which means that it won't order correctly and will order like 1, 10, 11, 12, 2, 3, 4 etc. To fix this the first part of this next layer checks if the week number is less than 10, if it is it then outputs '0' and then adds the week number onto that, if not it then outputs nothing and the week number on to the rest of the expression. This will produce the period in the format yyyy-ww, with ww being the week number. You can, of course, play around with this to change the way it's displayed and what you want to be shown.
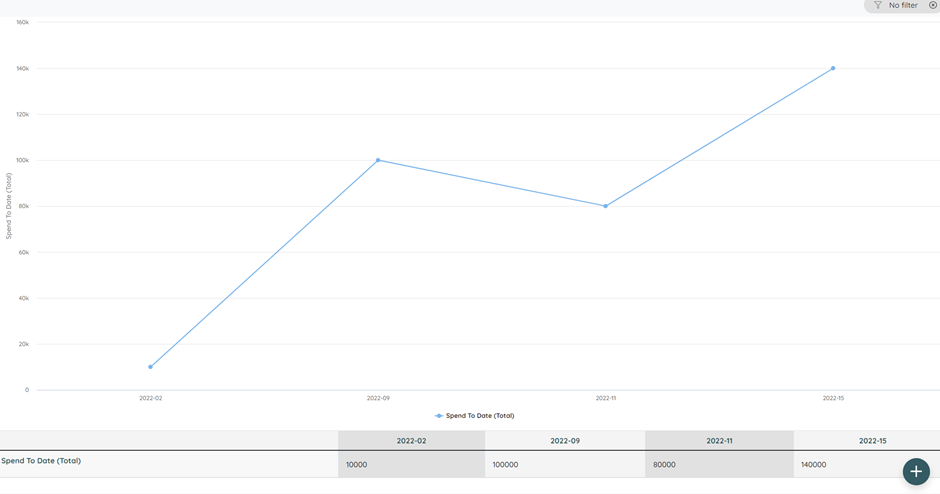
Then you can now use this field in charts, the example below is of a cumulative matrix chart that is showing the spend to date across 4 weeks. A key point in the configuration for this is for the period field to be the column field and the order column categories to be ticked.
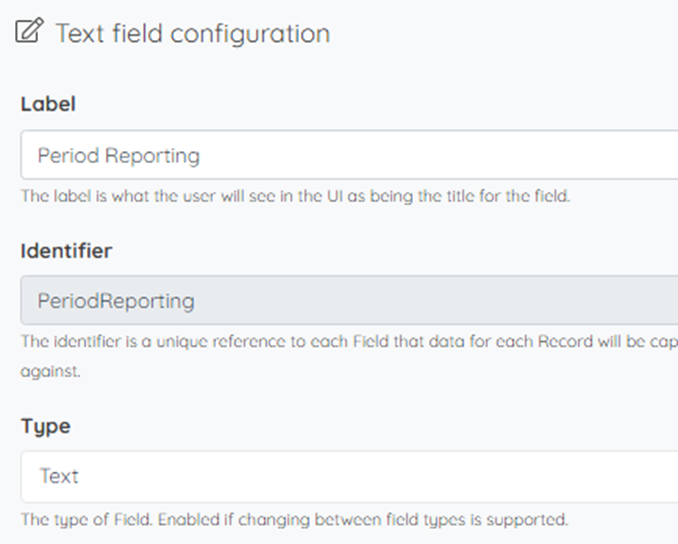
The last method I'll be showing you is if you want period to be displayed as text and not as a number, i.e. 2019 - 01) January - Week 3.
You need to create a field that checks what month it is, then constructs the output based on that, below I have added the expression.
if(isValidDate([DateActual]), if(month([DateActual]) = 1, string(Year([DateActual])) + ' - ' + '01) January' + ' - Week ' + if(weekNum([DateActual]) < 10, '0', '') + string(weekNum([DateActual])),
if(month([DateActual]) = 2, string(Year([DateActual])) + ' - ' + '02) February' + ' - Week ' + if(weekNum([DateActual]) < 10, '0', '') + string(weekNum([DateActual])),
if(month([DateActual]) = 3, string(Year([DateActual])) + ' - ' + '03) March' + ' - Week ' + if(weekNum([DateActual]) < 10, '0', '') + string(weekNum([DateActual])),
if(month([DateActual]) = 4, string(Year([DateActual])) + ' - ' + '04) April' + ' - Week ' + if(weekNum([DateActual]) < 10, '0', '') + string(weekNum([DateActual])),
if(month([DateActual]) = 5, string(Year([DateActual])) + ' - ' + '05) May' + ' - Week ' + if(weekNum([DateActual]) < 10, '0', '') + string(weekNum([DateActual])),
if(month([DateActual]) = 6, string(Year([DateActual])) + ' - ' + '06) June' + ' - Week ' + if(weekNum([DateActual]) < 10, '0', '') + string(weekNum([DateActual])),
if(month([DateActual]) = 7, string(Year([DateActual])) + ' - ' + '07) July' + ' - Week ' + if(weekNum([DateActual]) < 10, '0', '') + string(weekNum([DateActual])),
if(month([DateActual]) = 8, string(Year([DateActual])) + ' - ' + '08) August' + ' - Week ' + if(weekNum([DateActual]) < 10, '0', '') + string(weekNum([DateActual])),
if(month([DateActual]) = 9, string(Year([DateActual])) + ' - ' + '09) September' + ' - Week ' + if(weekNum([DateActual]) < 10, '0', '') + string(weekNum([DateActual])),
if(month([DateActual]) = 10, string(Year([DateActual])) + ' - ' + '10) October' + ' - Week ' + if(weekNum([DateActual]) < 10, '0', '') + string(weekNum([DateActual])),
if(month([DateActual]) = 11, string(Year([DateActual])) + ' - ' + '11) November' + ' - Week ' + if(weekNum([DateActual]) < 10, '0', '') + string(weekNum([DateActual])),
if(month([DateActual]) = 12, string(Year([DateActual])) + ' - ' + '12) December' + ' - Week ' + if(weekNum([DateActual]) < 10, '0', '') + string(weekNum([DateActual])), '')))))))))))),'')
It first checks if the date is valid and then runs through what month it is and then when it finds its match it with the month in the text format and then runs through the week number of the date.
Once done you can add the field to the report. Here is an example of what it will look like.
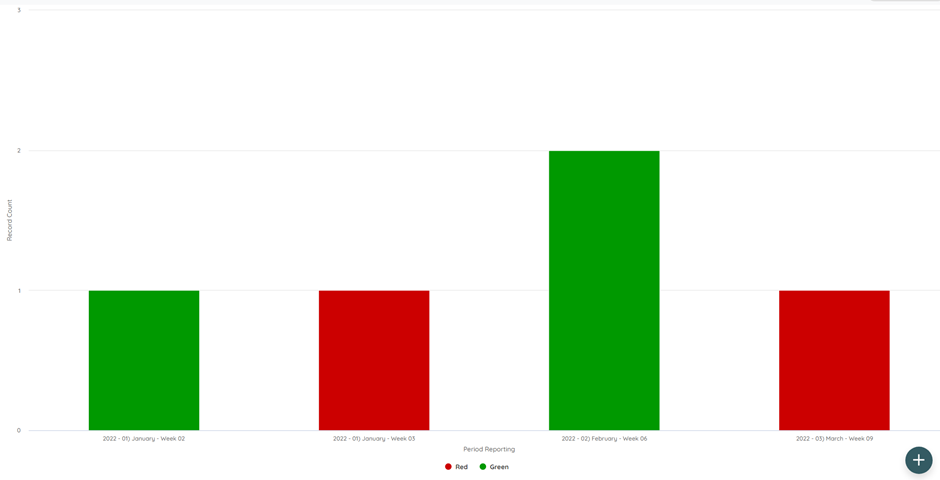
Tip - Always add the year at the front so that the years are grouped as well as months
Tip - Always add the year in otherwise it will group months in different years all under the same month
Please sign in to leave a comment.
Comments
0 comments